![]()
Sktime 中的窗口分割器#
在本笔记本中,我们将描述 `sktime.split <sktime/sktime>`__ 模块中包含的窗口分割器。这些分割器可以与 ForecastingGridSearchCV 结合使用进行模型选择(参见预测笔记本)。
注意:需要强调的是,对于时间序列中的交叉验证,我们不能随机打乱数据,因为这会泄露信息。
参考
准备工作#
[1]:
from warnings import simplefilter

import matplotlib.pyplot as plt
import numpy as np
import seaborn as sns
from matplotlib.ticker import MaxNLocator

from sktime.datasets import load_airline
from sktime.forecasting.base import ForecastingHorizon
from sktime.split import (
    CutoffSplitter,
    ExpandingWindowSplitter,
    SingleWindowSplitter,
    SlidingWindowSplitter,
    temporal_train_test_split,
)
from sktime.utils.plotting import plot_series
[2]:
def plot_windows(y, train_windows, test_windows, title=""):
    """Visualize training and test windows."""
    simplefilter("ignore", category=UserWarning)

    def get_y(length, split):
        # Create a constant vector based on the split for y-axis."""
        return np.ones(length) * split

    n_splits = len(train_windows)
    n_timepoints = len(y)
    len_test = len(test_windows[0])

    train_color, test_color = sns.color_palette("colorblind")[:2]

    fig, ax = plt.subplots(figsize=plt.figaspect(0.3))

    for i in range(n_splits):
        train = train_windows[i]
        test = test_windows[i]

        ax.plot(
            np.arange(n_timepoints), get_y(n_timepoints, i), marker="o", c="lightgray"
        )
        ax.plot(
            train,
            get_y(len(train), i),
            marker="o",
            c=train_color,
            label="Window",
        )
        ax.plot(
            test,
            get_y(len_test, i),
            marker="o",
            c=test_color,
            label="Forecasting horizon",
        )
    ax.invert_yaxis()
    ax.yaxis.set_major_locator(MaxNLocator(integer=True))
    ax.set(
        title=title,
        ylabel="Window number",
        xlabel="Time",
        xticklabels=y.index,
    )
    # remove duplicate labels/handles
    handles, labels = ((leg[:2]) for leg in ax.get_legend_handles_labels())
    ax.legend(handles, labels)
数据#
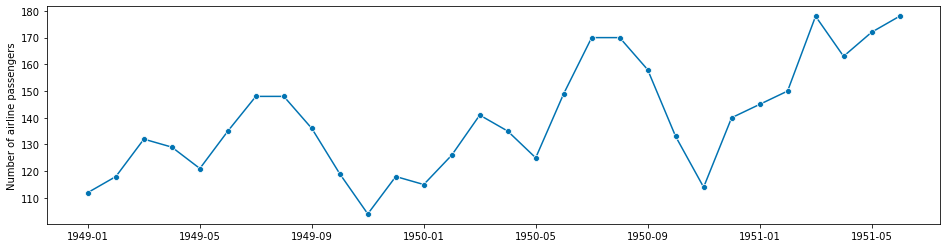
我们使用 Box-Jenkins 单变量航空公司数据集的一部分,该数据集显示了 1949 年至 1960 年期间每月国际航班乘客数量。
[3]:
# We are interested on a portion of the total data set.
# (for visualisatiion purposes)
y = load_airline().iloc[:30]
y.head()
[3]:
Period
1949-01    112.0
1949-02    118.0
1949-03    132.0
1949-04    129.0
1949-05    121.0
Freq: M, Name: Number of airline passengers, dtype: float64
[4]:
fig, ax = plot_series(y)
可视化时间序列交叉验证窗口分割器#
现在我们描述每种分割器。
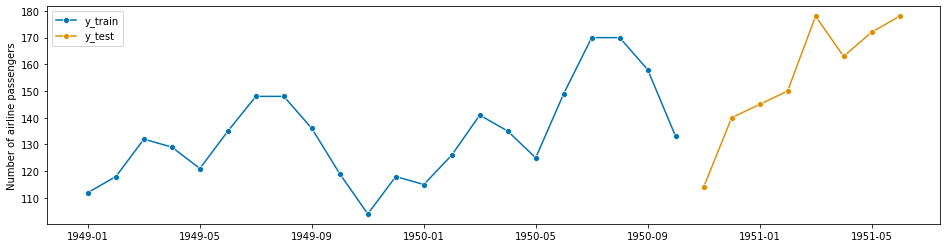
使用 temporal_train_test_split 进行单次训练集-测试集分割#
这种方法将数据分割成训练集和测试集。你可以 (i) 设置训练集或测试集的大小,或 (ii) 使用预测范围。
[5]:
# setting test set size
y_train, y_test = temporal_train_test_split(y=y, test_size=0.25)
fig, ax = plot_series(y_train, y_test, labels=["y_train", "y_test"])
[6]:
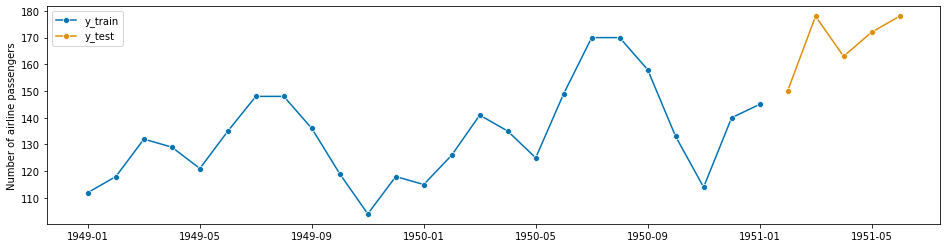
# using forecasting horizon
fh = ForecastingHorizon([1, 2, 3, 4, 5])
y_train, y_test = temporal_train_test_split(y, fh=fh)
plot_series(y_train, y_test, labels=["y_train", "y_test"]);
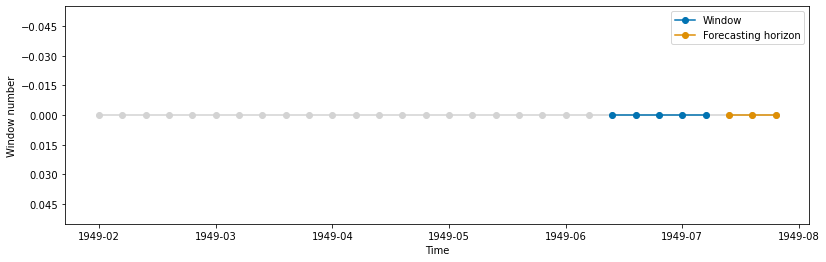
使用 SingleWindowSplitter 进行单次分割#
这个类将时间序列一次分割成一个训练窗口和一个测试窗口。注意,这与 temporal_train_test_split 非常相似。
让我们定义分割(折叠)的参数
[7]:
# set splitter parameters
window_length = 5
fh = ForecastingHorizon([1, 2, 3])
[8]:
cv = SingleWindowSplitter(window_length=window_length, fh=fh)
n_splits = cv.get_n_splits(y)
print(f"Number of Folds = {n_splits}")
Number of Folds = 1
让我们绘制生成的唯一分割(折叠)。首先我们定义一些辅助函数
[9]:
def get_windows(y, cv):
    """Generate windows."""
    train_windows = []
    test_windows = []
    for i, (train, test) in enumerate(cv.split(y)):
        train_windows.append(train)
        test_windows.append(test)
    return train_windows, test_windows
现在我们生成图表
[10]:
train_windows, test_windows = get_windows(y, cv)
plot_windows(y, train_windows, test_windows)
[11]:
test_windows
[11]:
[array([27, 28, 29])]
[12]:
train_windows
[12]:
[array([22, 23, 24, 25, 26])]
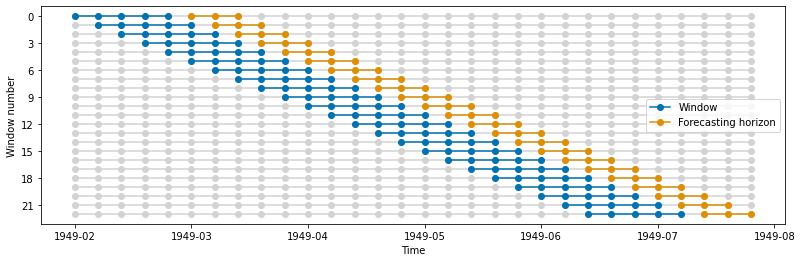
使用 SlidingWindowSplitter 的滑动窗口#
这种分割器生成的分割(折叠)随时间移动。每个分割(折叠)的训练集和测试集的长度保持不变。
[13]:
cv = SlidingWindowSplitter(window_length=window_length, fh=fh)

n_splits = cv.get_n_splits(y)
print(f"Number of Folds = {n_splits}")
Number of Folds = 23
[14]:
train_windows, test_windows = get_windows(y, cv)
plot_windows(y, train_windows, test_windows)
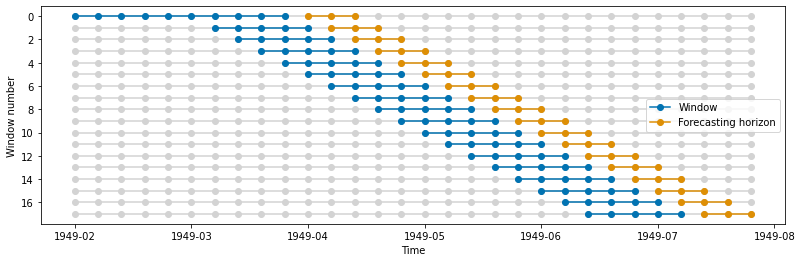
使用 SlidingWindowSplitter 带初始窗口的滑动窗口#
这种分割器生成的分割(折叠)随时间移动。每个分割(折叠)的训练集和测试集的长度保持不变。
[15]:
cv = SlidingWindowSplitter(window_length=window_length, fh=fh, initial_window=10)

n_splits = cv.get_n_splits(y)
print(f"Number of Folds = {n_splits}")
Number of Folds = 18
[16]:
train_windows, test_windows = get_windows(y, cv)
plot_windows(y, train_windows, test_windows)
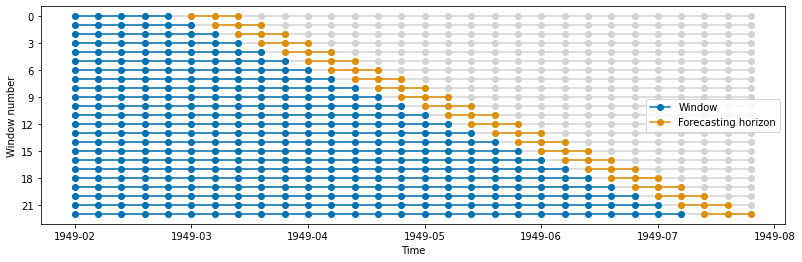
使用 ExpandingWindowSplitter 的扩展窗口#
这种分割器生成的分割(折叠)随时间移动。每个分割(折叠)的训练集长度增长,而测试集长度保持不变。
[17]:
cv = ExpandingWindowSplitter(initial_window=window_length, fh=fh)

n_splits = cv.get_n_splits(y)
print(f"Number of Folds = {n_splits}")
Number of Folds = 23
[18]:
train_windows, test_windows = get_windows(y, cv)
plot_windows(y, train_windows, test_windows)
在特定截止值进行多次分割 - CutoffSplitter#
使用这种分割器,我们可以手动选择截止点。
[19]:
# Specify cutoff points (by array index).
cutoffs = np.array([10, 13, 15, 25])

cv = CutoffSplitter(cutoffs=cutoffs, window_length=window_length, fh=fh)

n_splits = cv.get_n_splits(y)
print(f"Number of Folds = {n_splits}")
Number of Folds = 4
[20]:
train_windows, test_windows = get_windows(y, cv)
plot_windows(y, train_windows, test_windows)
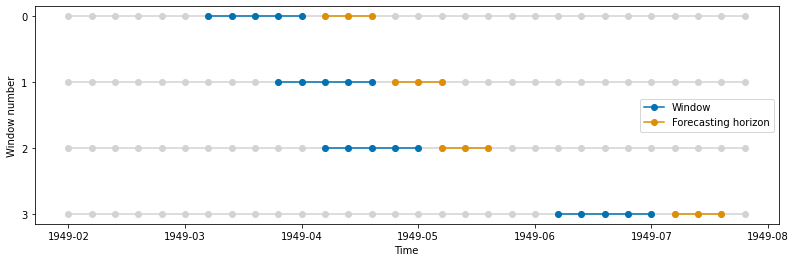
[21]:
train_windows
[21]:
[array([ 6,  7,  8,  9, 10]),
 array([ 9, 10, 11, 12, 13]),
 array([11, 12, 13, 14, 15]),
 array([21, 22, 23, 24, 25])]
[22]:
test_windows
[22]:
[array([11, 12, 13]),
 array([14, 15, 16]),
 array([16, 17, 18]),
 array([26, 27, 28])]